
Fletcher-Munson curves – explanation, meaning & influence
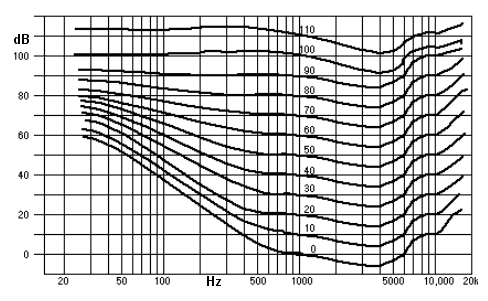
As early as the 1930s, Harvey Fletcher and Wilden A. Munson demonstrated that the human ear perceives frequencies differently depending on the volume. The Fletcher-Munson curves – also known as equal-loudness contours – describe this relationship: Low and high tones must be significantly louder at low volume levels to sound equally loud as mid-range frequencies.
What are Fletcher-Munson Curves?
The Fletcher-Munson curves were created as part of extensive listening experiments. Their goal was to understand the subjective perception of loudness across the audible frequency spectrum.
The Fletcher-Munson curves, also called equal-loudness contours, show how loud sounds are perceived at different frequencies. They were developed in the 1930s by researchers Harvey Fletcher and Wilden A. Munson. Their research showed that human hearing responds differently to sound at different frequencies.
The Fletcher-Munson curves show that some sounds at low and high frequencies need to be louder than midrange sounds to be perceived as equally loud. This means that we perceive low and high frequencies less clearly at low listening levels than at moderate levels in the midrange.
You will learn practical tips for correctly evaluating volume, frequencies and EQ decisions in a mix in the Mixing Guide.
Where are the Fletcher-Munson curves used?
The curves have an important function in audio technology. They particularly help in the development of audio equipment and equalizers to ensure that sounds are perceived evenly across the entire frequency spectrum. This also compensates for the natural fluctuations in the hearing sensitivity of the human ear.
Hearing sensitivity at different volumes
The curves show that the sensitivity of hearing does not remain the same, but depends on the volume. At low volumes, hearing is less sensitive to low and high frequencies compared to medium frequencies. At higher volumes, the sensitivity of hearing at different frequencies becomes more similar.
The Fletcher-Munson curves explain why your mix sounds different at different volume levels — how you can actively use this in mastering is explained by the Mastering Guide .
Especially at low listening levels, perception influences your mixing decisions – you can read why headroom is crucial in the article on headroom.
Application in audio technology:
The findings of the Fletcher-Munson curves are important in audio engineering. During recording, mixing and playback of audio content, differences in hearing sensitivity must be taken into account. Audio engineers use equalizers to correct frequencies so that sounds are perceived as equally loud at normal listening levels, regardless of their frequency.
We explain how equalizers can be used to compensate for level differences in our article on equalizers.
ISO 226
The Fletcher-Munson curves were used as the basis for the development of the ISO 226 standard used, which standardizes the sensitivity of human hearing. This standard establishes reference sound pressure levels to ensure consistent loudness across audio devices and applications.
K- and A-weighting.
Special filters such as K- and A-weighting were developed to account for hearing sensitivity at different loudness levels. They are used in sound level measurements to approximate the weighting of equal-loudness contours.
Overall, Fletcher-Munson's curves have helped provide a basis for better device and recording design in the audio field. This ensures that the sounds are reproduced in a way that matches human perception.
Actively use Fletcher-Munson in the mix: You will learn how to practically apply the curves in your mixing and mastering workflow — from the correct monitoring volume to the reference track method — in this course. 1:1 coaching at Peak-Studios.
In mastering practice: The Fletcher-Munson curves play a crucial role in determining whether a master sounds balanced at every listening volume. How we achieve this in the Online mastering at Peak-Studios You can see how to make sure of this on our service page.
Frequently asked questions about the Fletcher-Munson curves
Why does music sound thinner (less bass and treble) at low volume?
Human hearing is not equally sensitive across all frequencies – and this sensitivity changes with age. Sound Pressure LevelAt low volume, you perceive bass and treble much less strongly than the midrange, which is why quietly played music often sounds thin and mid-heavy. As the volume is turned up, bass and treble become more prominent again – this is the core principle of the Fletcher-Munson curves.
At what volume level should you mix and master?
A moderate, constant monitoring level has proven effective as a reference – often in the range of 75–85 dB SPL, depending on the room and listening distance; very loud levels are only useful briefly and after calibration. More important than the exact value is that you keep your monitoring volume constant so that your frequency decisions remain comparable throughout the session. A quick check at a lower volume will also reveal whether the balance holds up at that level.
What is the difference between Fletcher-Munson curves and today's ISO 226 curves?
The original measurements by Fletcher and Munson from the 1930s were later supplemented by further studies (including Robinson-Dadson); the currently valid standard is ISO 226:2023. The current curves are considered more accurate, but the basic principle remains the same: perceived loudness depends on frequency and level. For studio use, the Fletcher-Munson curves are perfectly adequate as a clear and illustrative model.
What are equal volume curves (isophones)?
Isophones – also called equal-loudness curves – connect all tones that are perceived as equally loud despite having different frequencies. Their unit is the phon, which is linked to the sound pressure level at 1 kHz (in DecibelThe Fletcher-Munson curves are precisely such isophones.
Is it possible to counteract the Fletcher-Munson effect?
It cannot be completely compensated for because it originates in the ear itself. Older hi-fi systems had a loudness button that selectively boosted bass and treble at low volumes; some modern systems offer a similar, level-dependent sound correction. However, the most reliable method remains listening at a constant, sufficiently high volume.